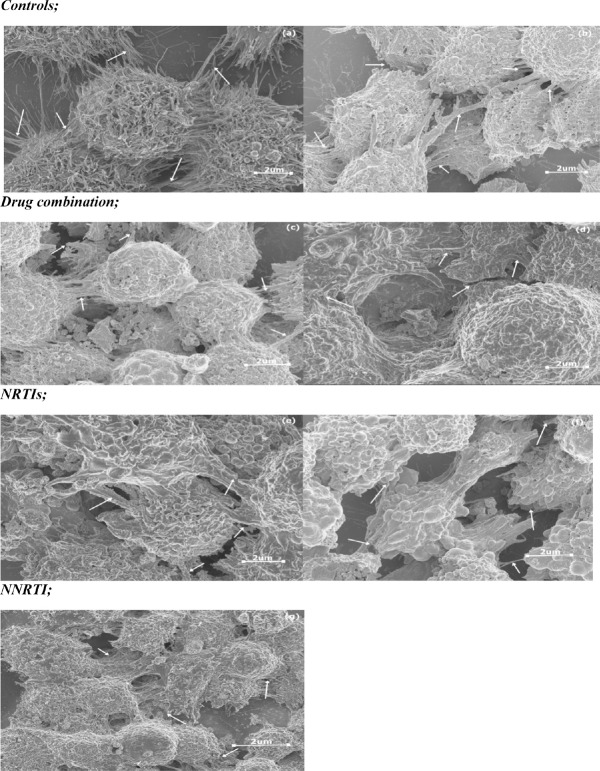
Fig. 2.
The change in cell contacts following drug treatment in HCS-2 cells; (a) Negative control, (b) Diluent control, (c) ATP, (d) LPV/r, (e) FTC, (f) TDF, (g) EFV. The arrows show where cell contacts are found represented by long lateral protrusions, filopodia. Extensive cell contacts were characteristic in (a), with drug treatment as observed in (b-g) they were reduced and some were damaged in varying degrees.

