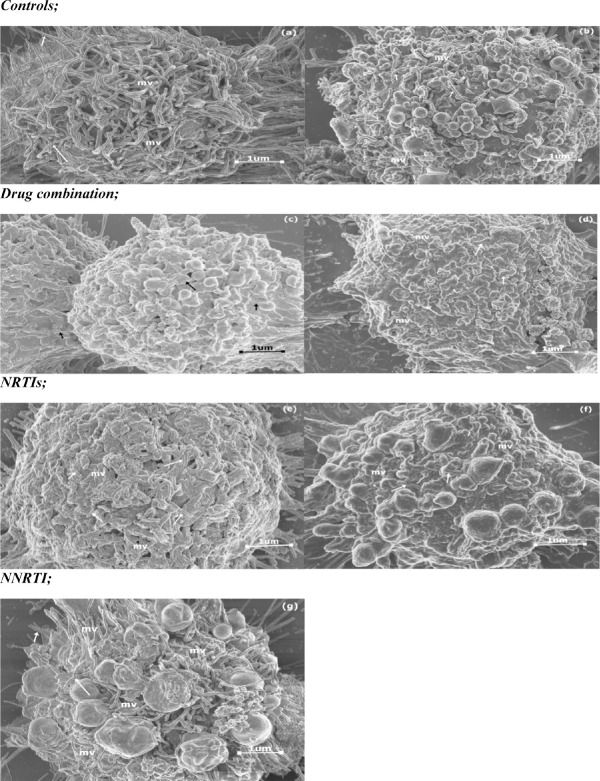
Fig. 4.
The change in density and size of microvilli (mv) following drug treatment (arrows highlight the length of mv); (a) Negative control, (b) Diluent control, (c) ATP, (d) LPV/r, (e) FTC, (f) TDF and (g) EFV. In all the treated cells (b-g) microvilli density decreased in comparison to (a) and the microvilli observed in (c-f) were shorter in comparison to (a) and those seen in (g) were slightly shorter than those in (a), but longer than those seen in other drug treatments (c-f).

