An official website of the United States government
Here's how you know
Official websites use .gov
A
.gov website belongs to an official
government organization in the United States.
Secure .gov websites use HTTPS
A lock (
) or https:// means you've safely
connected to the .gov website. Share sensitive
information only on official, secure websites.
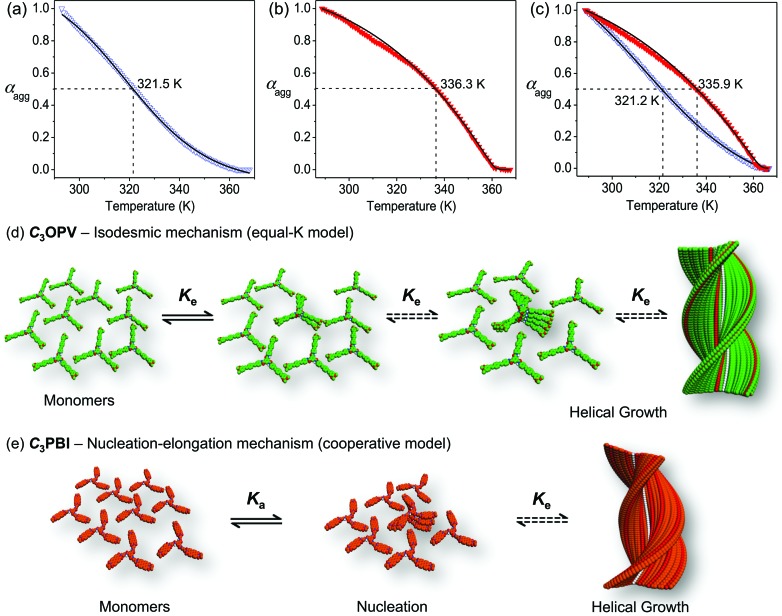
 ), C3PBI (
 ) and curve fitting (
 ). Absorbance was monitored at 425 and 527 nm for C3OPV and C3PBI, respectively, with a rate of cooling of 1 K min–1. Schematic illustration of the self-assembly pathway of (d) C3OPV and (e) C3PBI. Ke is the association constant and Ka is the activation constant expressing the degree of cooperativity.