. 2016 Mar 15;7(7):4435–4443. doi: 10.1039/c5sc04664e

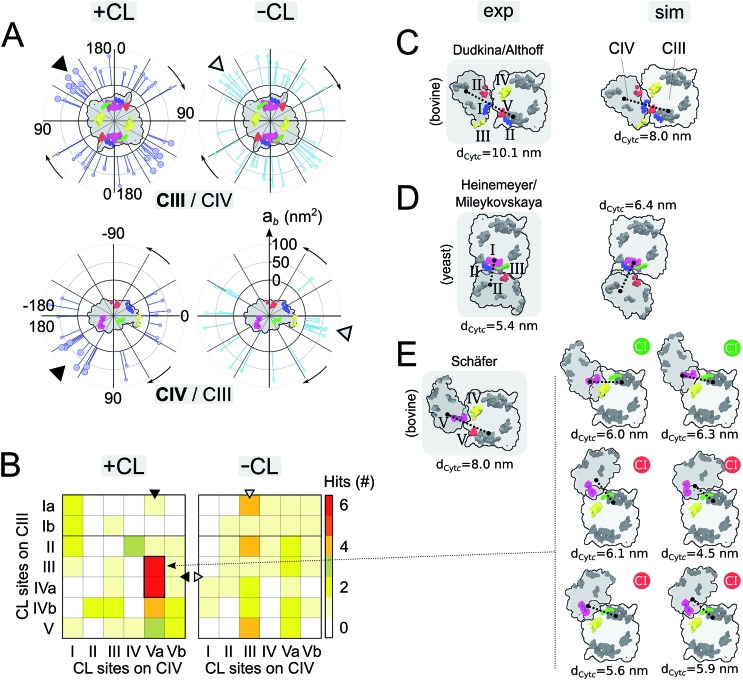
Fig. 3. Supercomplex architectures: (A) location of CIII/CIV interfaces on CIII (top panels) and CIV (bottom panels) in +CL and -CL membranes. Each stick represents the projection of an interface onto a circle surrounding the protein. The location of an interface, γ1 and γ3, is determined by the position of the centers of mass of the residues contributing to it for each partner (see Fig. S14 and the ESI Methods for details). The length of a stick reports the protein burial, ab, corresponding to the interface. Similar analysis for CIV/CIV interfaces is shown in Fig. S5. The favored interfaces found with CL (see panels B and E) are shown by a larger head stick. A triangle points towards the denser zone of contacts on CIII and CIV in the system with and without CL. (B) Contact map of CL binding sites in CIII/CIV SCs from the simulations +CL and -CL. Sites are assumed to form a contact when distant by <3.0 nm (see Methods in the ESI). Similar analysis for CIV/CIV SCs is shown in Fig. S5. Sites on the inter-membrane space side of the bilayers (VICIV, VIIaCIV and VIIbCIV) are not reported. In all cases, the C2 symmetry axis of the CIII dimer is used to average over both monomers. (C and E) Simulated vs. experimental and plasticity of CIII/CIV interfaces. Experimental models were derived: for bovine heart mitochondria (panel C) from Althoff et al.4 or Dudkina et al.,3 (panel E) from Schäfer et al.2 and for yeast (panel D) Heinemeyer et al.7 or Mileykovskaya et al.8 The CL binding sites are colored when in contact (<3.0 nm) following the color code defined in Fig. 1 or left grey otherwise. The yeast model was provided by Heinemeyer et al. Althoff's bovine model was taken from the PDB entry ; 2ybb. Schäfer's model was built by visual fitting of CIII and CIV onto Fig. 2 and 3 from ref. 2 and thus should be considered qualitatively. The surface SCs are projected onto the membrane plane from the matrix with the orientation of CIII conserved. The distance between cytochrome c, dCytc, binding sites on CIII and CIV are given in (C)–(E) and detailed in Fig. S11. In (E), the compatibility of the configuration with its association with complex I is indicated by a green (possible) or red (not possible) circle, see Fig. S12 for details.

Fig. 3