. 2016 Mar 15;7(7):4435–4443. doi: 10.1039/c5sc04664e

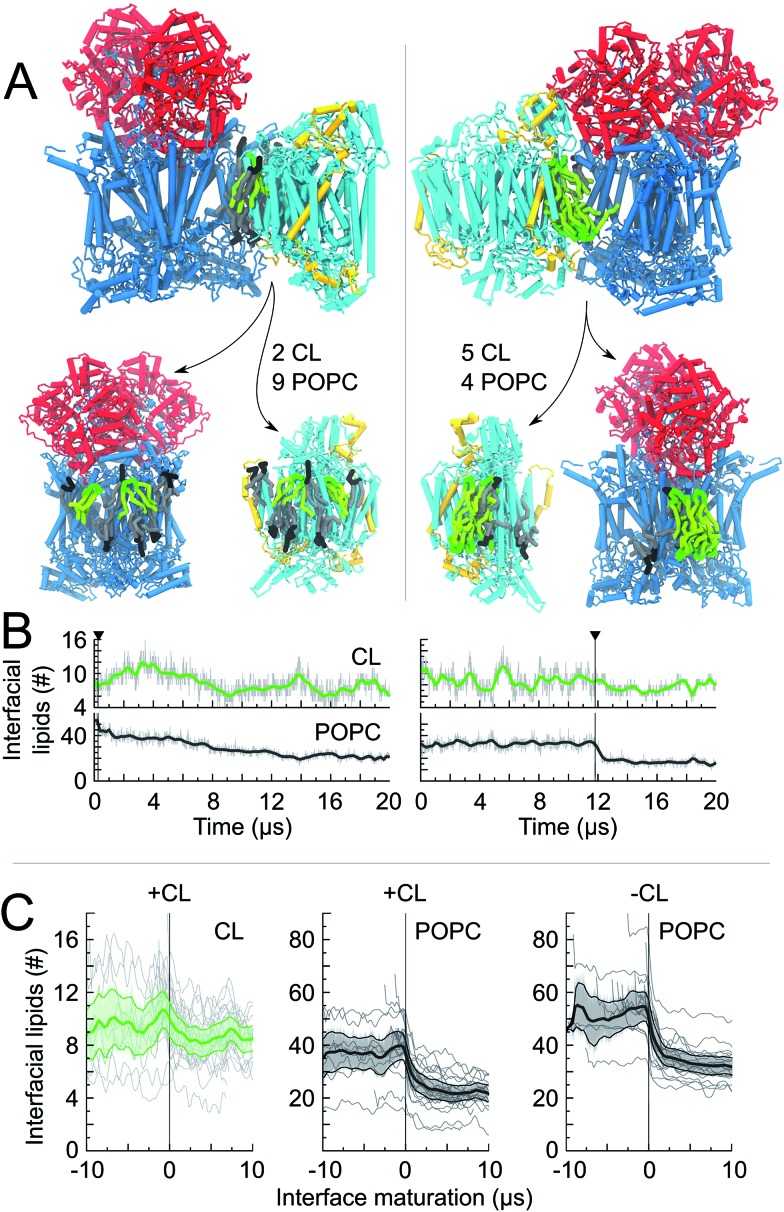
Fig. 4. Lipid content of CIII/CIV interfaces. For two CIII/CIV SCs we show: (A) a snapshot of the interfaces, t = 20 μs, which is cut open to show the lipid content (CL and POPC) at the protein surfaces. The number of shared lipids is indicated. In one case (left) the interface is formed early in the simulation and is followed by a long maturation of the interface with POPC being removed at timescales up to 14 μs. In the second case (right) the interface is formed late and POPC molecules are expelled quickly; (B) the time evolution of the number of interfacial lipids for the interface depicted in the snapshot. The vertical line denotes the formation of the interface; (C) the average number of interfacial lipids (CL and POPC) over all interfaces formed in the simulations; time relates here to interface maturation: t = 0 corresponds to the time of formation of the first contact of an interface.

Fig. 4