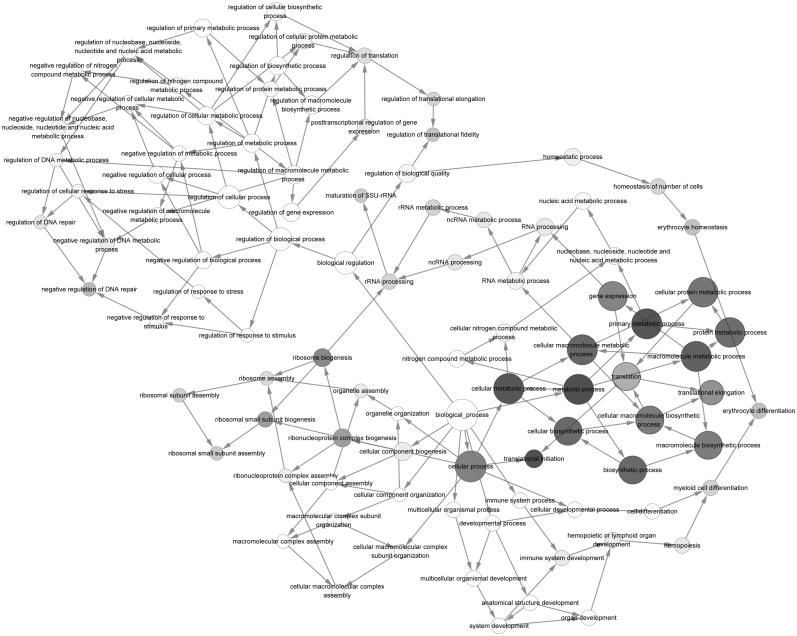
Figure 3.
The GO correlation of highest score sub-modules. Gray nodes represent the significant GO terms and white nodes represent the non-significant GO terms. Node in a larger node size and a darker color represents a more significant GO term; arrows indicate relevancy of the two GO terms. GO: gene ontology.

