
Figure 5.
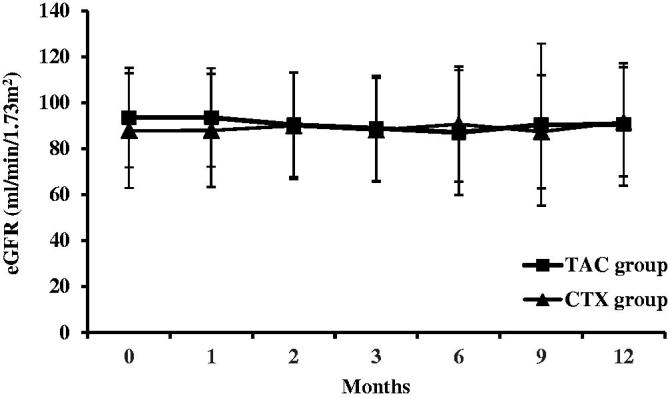
Changes of eGFR (mean ± SD) during the 12 months of therapy in the TAC and CTX group.
Official websites use .gov
A
.gov website belongs to an official
government organization in the United States.
Secure .gov websites use HTTPS
A lock (
) or https:// means you've safely
connected to the .gov website. Share sensitive
information only on official, secure websites.
Changes of eGFR (mean ± SD) during the 12 months of therapy in the TAC and CTX group.