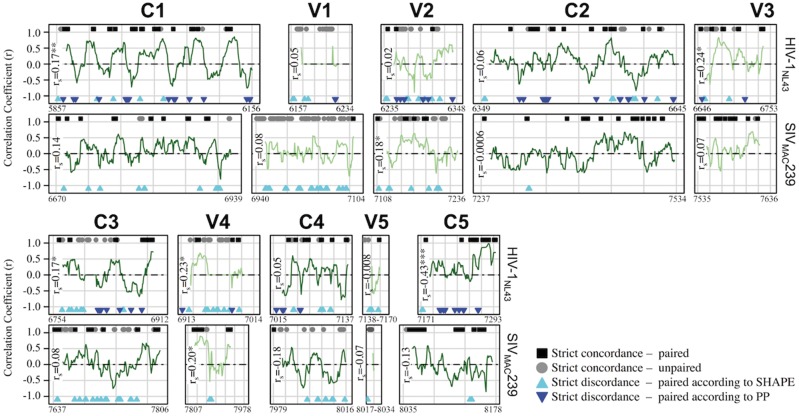
Figure 5.
Correlation analysis of SHAPE reactivity and pairing probability for HIV-1NL4-3 and SIVMAC239 gp120 reference sequences. Normalized (0–1) SHAPE reactivity values and RNA-Decoder-derived pairing probabilities (PPROB) for individual nucleotides throughout gp120 (A) were obtained from Pollom et al. (2013) and Watts et al. (2009). A running correlation analysis (fifteen nucleotide window) was used to assess the level of agreement between the two methods and to identify conserved RNA structures within constant (‘C’, light green lines) and variable (‘V’, dark green lines) regions. In addition to plotted correlation coefficients (r), individual sites identified as exhibiting strict concordance or discordance between the two methods were indicated along the x-axis at y + 1 and y−1, respectively. Strict paired concordance (black square) was defined as ≤25th percentile of the total gp120 normalized SHAPE reactivity distribution (HIV = 0.013, SIV = 0.026) and ≥25th percentile of the total gp120 normalized PPROB distribution (HIV = 0.73, SIV = 0.65). Strict unpaired concordance (grey circle) was defined as ≥75th percentile of the total gp120 normalized SHAPE reactivity distribution (HIV = 0.059, SIV = 0.084) and ≤25th percentile of the total gp120 Pprob normalized distribution (HIV = 0.02, SIV = 0.05). Strict discordance refers to the combination of these thresholds, with each of the two colored triangles representing base pairing according to one method and flexibility according to the other. Spearman correlation coefficient (rs) was estimated for all values within each gp120 region. *P value ≤ 0.01, **P value ≤ 0.001, ***P value ≤ 0.0001.

