Figure 1.

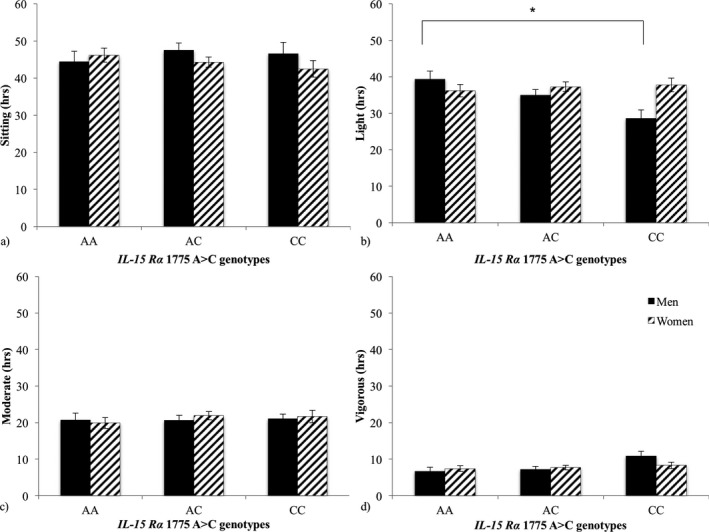
Time spent (X ± SEM) sitting (a) and in light (b), moderate (c), and vigorous (d) physical activity (hr) by IL‐15Rα 1775 A>C (rs2228059) genotype and sex

Time spent (X ± SEM) sitting (a) and in light (b), moderate (c), and vigorous (d) physical activity (hr) by IL‐15Rα 1775 A>C (rs2228059) genotype and sex