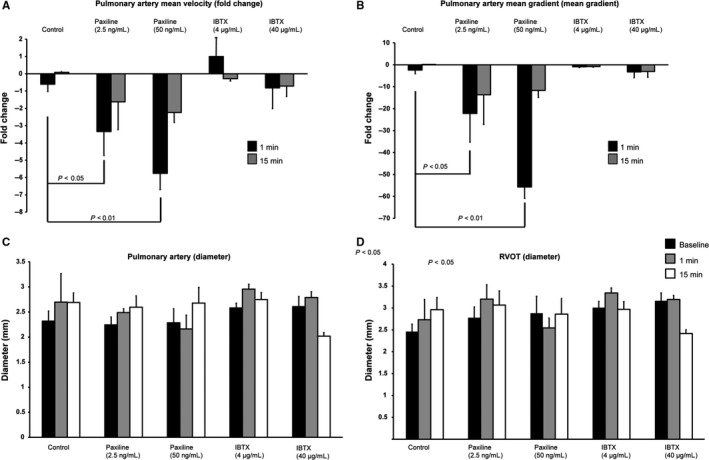
Figure 5.

Evaluation of pulmonic artery and right heart function after administration of Paxilline (n = 5) or Iberiotoxin (n = 4). (A) Bar graph showing fold change in mean pulmonary velocity. (B) Bar graph representing fold change in mean pulmonary gradient. (C) Absolute change in pulmonary artery diameter. (D) Absolute change in right ventricular outflow tract diameter. Velocity across the pulmonic valve was decreased 1 min after administration of both low‐dose and high‐dose Paxilline. In both dosages, velocity began to show normalization by 15 min. Mean pulmonary gradient showed a similar trend. In both cases, Iberiotoxin did not show an effect. No differences were seen in pulmonary artery diameter and right ventricular outflow tract diameter.
