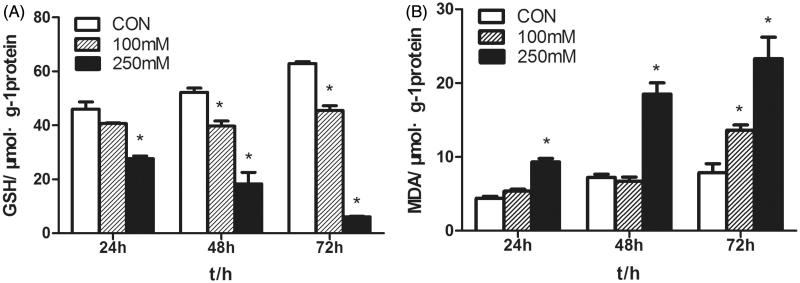
Figure 2.
Effects of mannitol on GSH and MDA levels in HK-2 cells. (A) The content of GSH in the HK-2 cells treated with various concentrations of mannitol for 24, 48, 72 h. (B) The MDA levels of the HK-2 cells treated with various concentrations of mannitol for 24, 48, 72 h. Note: Compared with the control group, ‘*’ indicated significant difference (p < .05).

