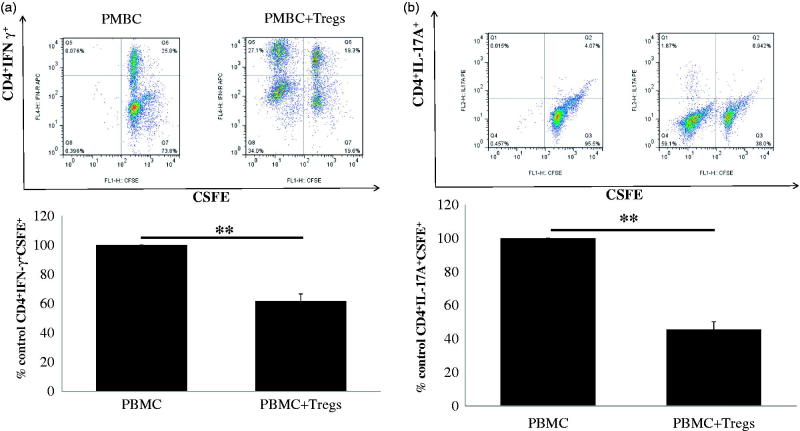
Figure 3.
Suppressive capacity of allogeneic low-dose IL-2-expanded regulatory T cells (Tregs). Suppressive capacity of IL-2-expanded Tregs obtained from 17 CKD patients was tested in a mixed lymphocyte reaction, inducing IFN-γ-producing Th1 cells and IL-17A-producing Th17 cells to the initial stimulus (i.e. alloantigen-induced proliferation. (a) A typical example dot plot of the gating strategy CSFE+ IFN-γ+ for Th1 cells by flow cytometry-based cell characterizing is given (upper panel). In the lower panel, a typical example of the percentage of inhibition on IFN-γ-producing Th1 cells is depicted (n = 17). (b) A typical example dot plot of the gating strategy CSFE+ IL-17A+ for Th17 cells by flow cytometry-based cell characterizing is given (upper panel). In the lower panel, a typical example of the percentage of inhibition on IFN-γ-producing Th1 cells is depicted in the graph (n = 17). p Values are depicted in the graph. *p < .05, **p < .01 for comparisons between the IL-2 treated group and the non-IL-2 treated group using t-tests.

