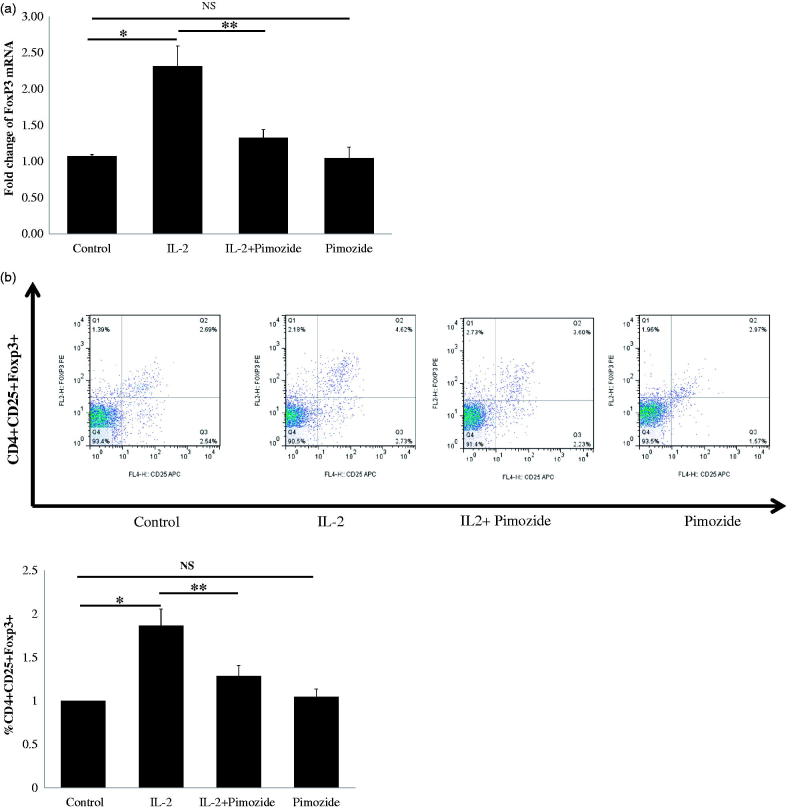
Figure 6.
Blockage of STAT5 activation attenuates IL-2-induced Tregs expansion and FoxP3 mRNA expression in PBMCs from 10 CKD patients. (a) A typical example dot plot of the gating strategy CD4+CD25+ FoxP3+ and CD4+CD25hi for Tregs by flow cytometry-based cell characterizing is given. (b) Block of activation of STAT5 by pimozide-attenuated IL-2-induced CD4+CD25+ FoxP3+ Tregs expansion is depicted in the graph (n = 9). The data are expressed as the mean ± SEM, with nine patients per group. (c) Block of activation of STAT5 by pimozide-attenuated IL-2-induced CD4+CD25hi Tregs expansion is depicted in the graph (n = 7). The data are expressed as the mean ± SEM. (d) Block of activation of STAT5 by pimozide-attenuated IL-2-induced expression of FoxP3 mRNA is depicted in the graph. The data are expressed as the mean ± SEM. p Values are depicted in the graph. *p < .05, **p < .01 for comparisons between the IL-2 treated group and the non-IL-2 treated group using one-way ANOVA analysis.

