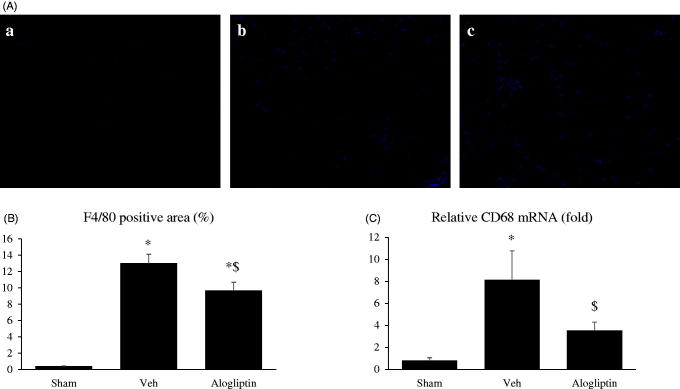
Figure 3.
(A) Representative images of F4/80-stained slices of kidneys from mice of the (a) sham-operated, (b) vehicle-treated, and (c) alogliptin-treated groups (original magnification, ×200). (B) Percentage of tubulointerstitial area positive for F4/80 staining in kidneys in the sham-operated (sham, n = 10), vehicle-treated (veh, n = 8), and alogliptin-treated (alogliptin, n = 9) groups. *p < 0.001 compared with the sham-operated group. $p < 0.01 compared with the vehicle-treated group. (C) Relative expression levels of CD68 messenger RNA (mRNA) in kidneys in each group. Glyceraldehyde 3-phosphate dehydrogenase (GAPDH) mRNA was used as the internal control to adjust for unequal total mRNA content. C *p < 0.01 compared with the sham-operated group; $p < 0.05 compared with the vehicle-treated group.

