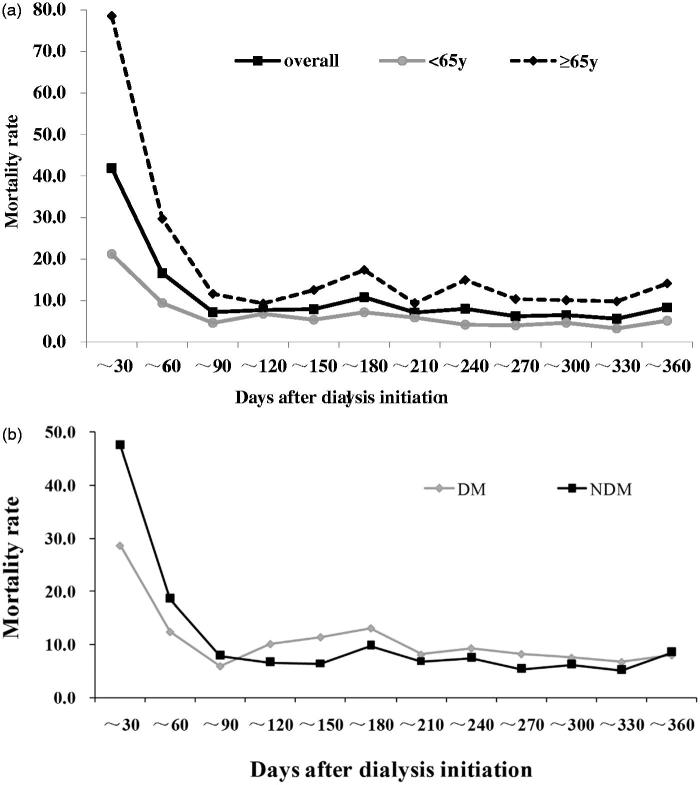
Figure 4.
Mortality rates by dialysis vintage, age and primary cause. y coordinate mortality rate (per 100 patient-years); x coordinate: days after dialysis initiation. (a) The monthly mortality rates and mortality rates by age (<65 y or ≥65 y) were calculated. The first 30-day mortality was highest in our cohort. Mortality rate for elderly patients (≥65 y) was higher in every interval than younger patients (<65 y). (b) Within the 90 days of dialysis initiation, mortality rate for NDM patients was higher than DM patients, while the trend reversed after that. DM: diabetes; NDM: nondiabetic disease; y: years old.

