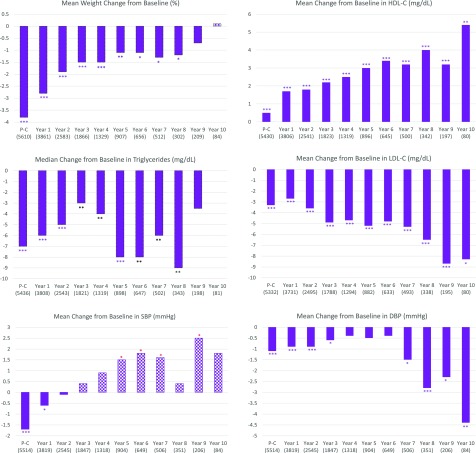
Figure 3.
Changes in secondary outcomes among SDPI-DP participants based on paired data. Means compared with paired t tests; medians compared with signed rank test. Numbers in parentheses in the second row of the horizontal axis are sample sizes. *P < 0.05; **P < 0.001; ***P < 0.0001. DBP, diastolic BP; P-C, postcurriculum assessment; SBP, systolic BP.

