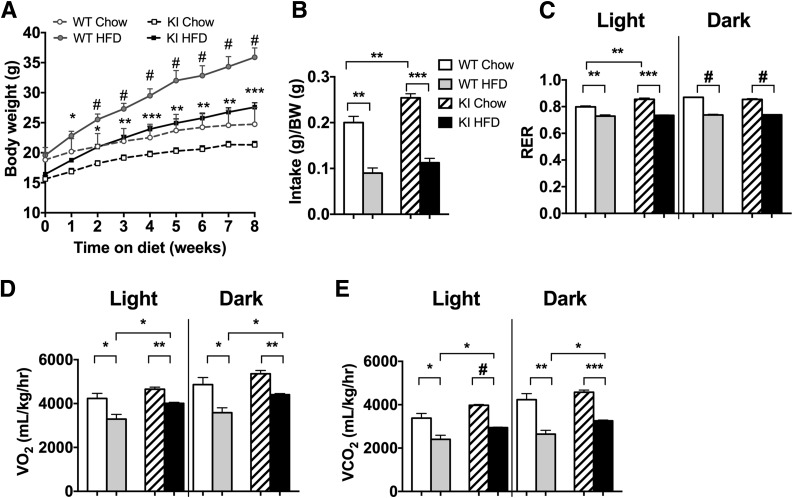
Figure 1.
Pik3r1 R649W mice are resistant to HFD-induced obesity. A: Body weight of WT and Pik3r1 R649W KI mice measured over 8 weeks of CD or HFD, shown as mean ± SEM of 12–14 animals per group. *P < 0.05, **P < 0.01, ***P < 0.001, #P < 0.0005, one-way ANOVA. Data from CLAMS of mice in week 8 of diet shows daily food intake normalized to body weight (BW) (B), and respiratory exchange ratio (RER) (C), VO2 (D), and VCO2 (E) in light and dark cycle, shown as the average of two 24-h cycles. **P < 0.01, ***P < 0.001, #P < 0.0005, t tests.

