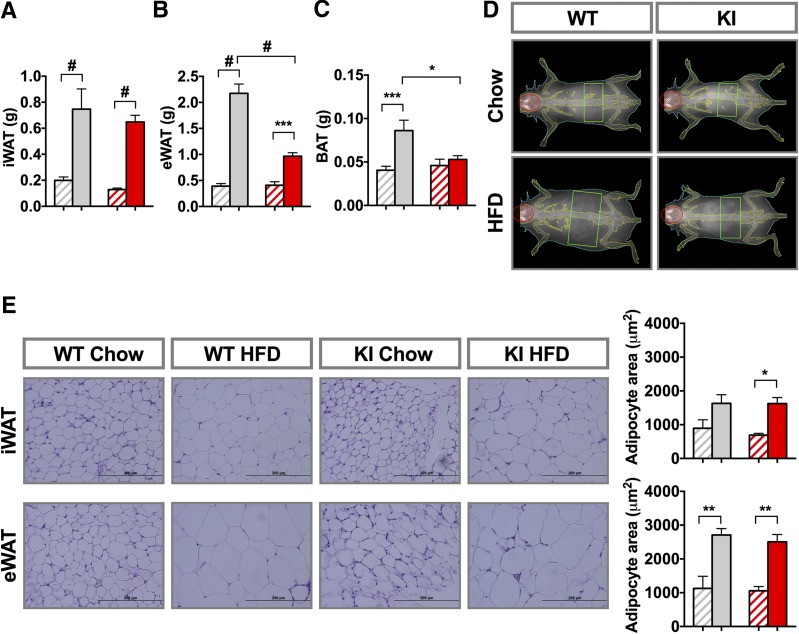
Figure 2.
Pik3r1 R649W mice have reduced adipose tissue mass gain by HFD. Weight of iWAT (A), eWAT (B), and BAT (C) after 8 weeks on the CD or HFD. D: Representative DEXA images after the end of the 8-week diet period. E: Hematoxylin and eosin staining of formalin-fixed sections from representative inguinal and epididymal tissue and average adipocyte area (n = 4). Results are shown as mean ± SEM. *P < 0.05, **P < 0.01, ***P < 0.001, #P < 0.0005, one-way ANOVA. Gray diagonal bars: WT chow mice; gray bars: WT HFD mice; red diagonal bars: KI chow mice; red bars: KI HFD mice.

