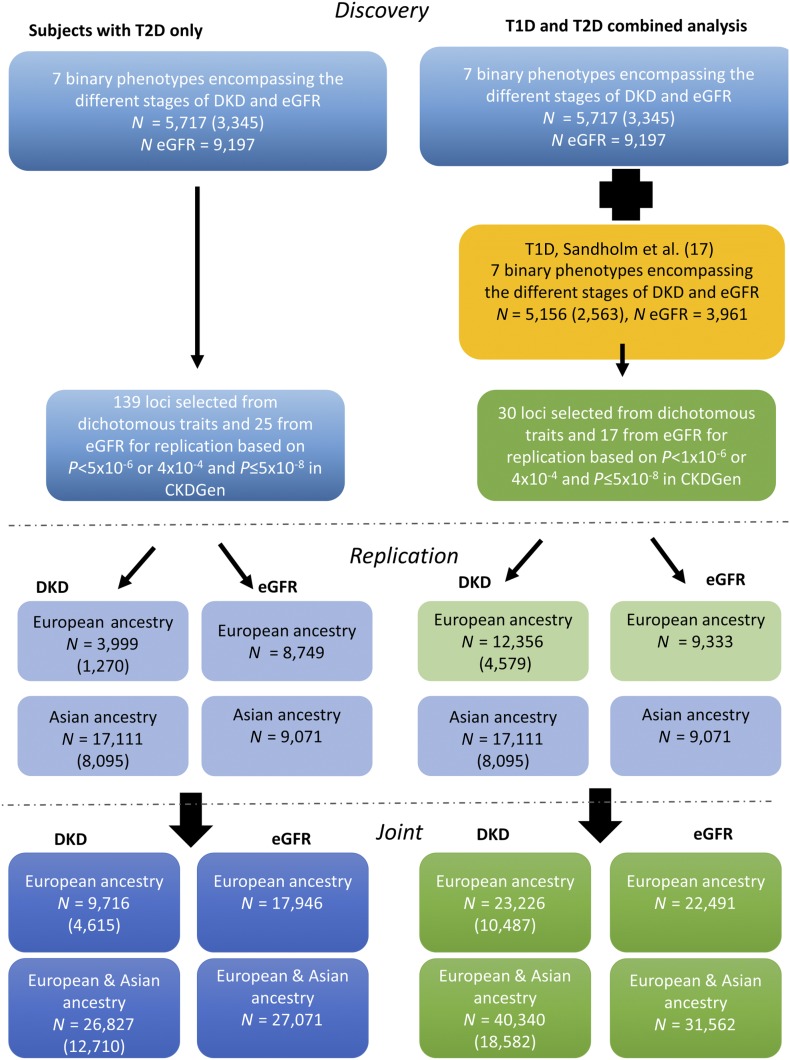
Figure 1.
Eight DKD phenotypes were analyzed in subjects with T2D (blue boxes) and in a combined (green boxes) analysis of subjects with T2D or T1D (yellow box). N indicates the total sample count for either the all DKD (number of case subjects is given in parentheses) or the eGFR phenotype and may vary by variant as well as by DKD phenotype. Replication was sought for 164 loci and 47 loci from each analysis, respectively, in subjects of European and Asian ancestry with either T1D or T2D.

