Figure 3.
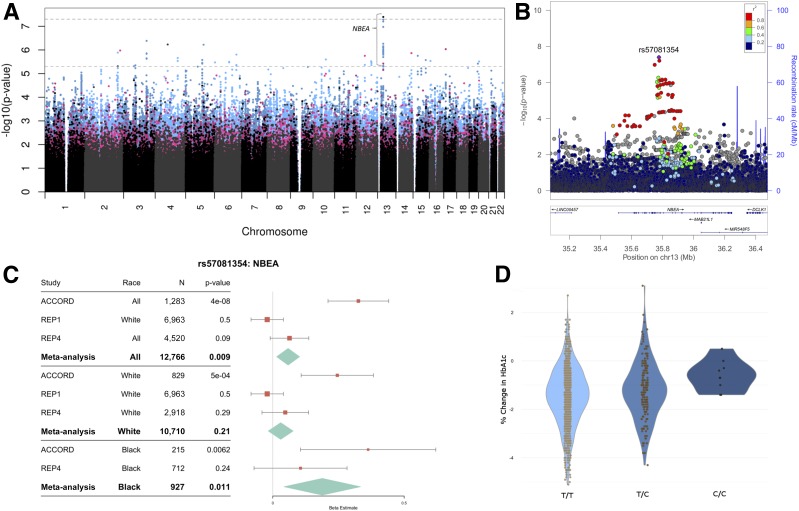
HbA1c response to metformin treatment is diminished by SNPs in NBEA. A: Manhattan plot of HbA1c response to metformin treatment when all races were combined (N = 1,312). The horizontal dashed lines represent suggestive statistical significance (P = 5 × 10⁻⁶) (bottom line) and genome-wide significance (P = 5 × 10⁻⁸) (top line). Each point represents a single SNP. Genotyped SNPs are represented with black dots, imputed SNPs are represented by blue dots, and SNPs meta-analyzed from subjects genotyped in Set 1 subjects and imputed in Set 2 subjects are represented by pink dots. B: A LocusZoom (48) plot demonstrating the lead SNP, rs57081354, association with change in HbA1c when all races are combined. Linkage disequilibrium was calculated using the 1000 Genomes reference panel using the hg19/1000 Genomes Nov 2014 EUR selection, matching the panel used to perform imputation in ACCORD. C: Forest plot demonstrating associations of rs57081354 in available replication cohorts. The β values for REP1 were changed to the additive inverse to maintain a consistent direction of effect. A larger β value means a diminished metformin response. Data for rs57081354 were not available for REP2 and REP3. Bars represent the 95% CIs. D: Change in HbA1c by rs57081354 genotype as represented by violin plots.

