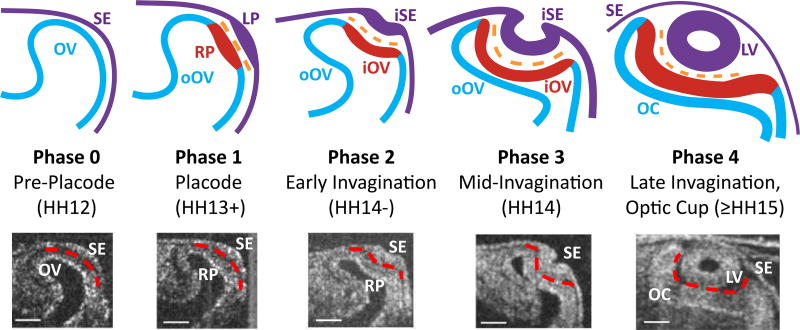
Fig. 1.
Morphology of optic cup in five phases. Top row Schematic diagram of phases of optic cup formation (OV = optic vesicle, blue; oOV = outer OV, blue; iOV = inner OV, red; SE = surface ectoderm, purple; iSE = inner SE, purple; RP = retinal placode, red; LP = lens placode, purple; ECM = extracellular matrix, orange). Bottom row Representative OCT images for each phase. Dashed red lines indicate boundary between the SE and OC. Phase 0, pre-placode The OV and SE are in contact but have not thickened. Phase 1, placode The two cell layers become tightly adhered via ECM and thicken to form the RP and LP. Phase 2, early invagination The OV and iSE begin to invaginate. Phase 3, mid-invagination Significant curvatures are apparent. Phase 4, late invagination The OC and LV have formed. Scale bars 100 µm

