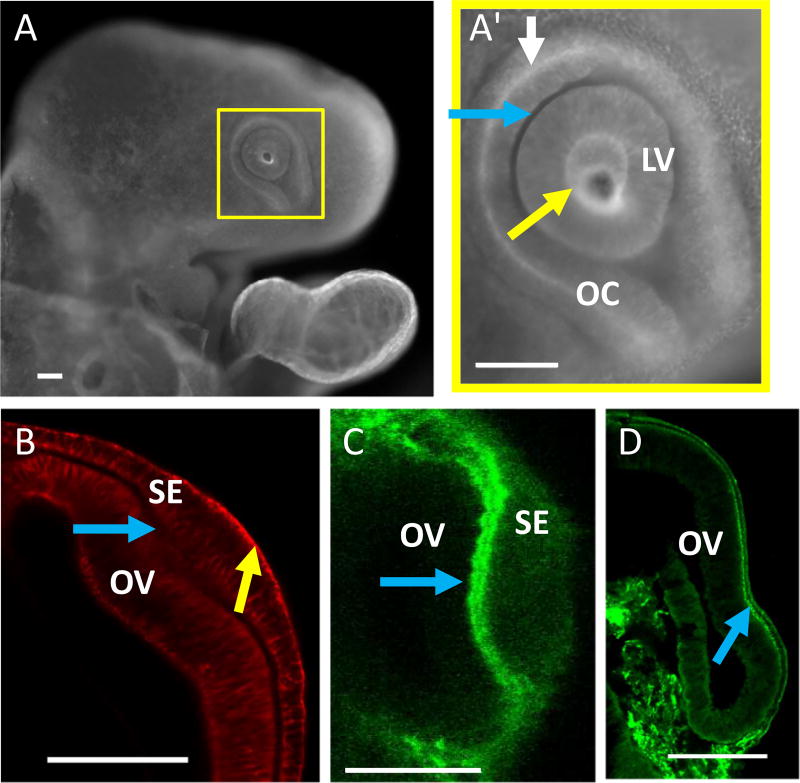
Fig. 2.
Distributions of actin and ECM in the eye. (A, HH14) Whole-mount stain of F-actin. (A’) is an enlarged view of yellow box in (A) showing concentrated actin along the apical surface of the SE (yellow arrow) and OC (white arrow) but not the basal surface of the OC (blue arrow). (B, HH13+) section during early invagination also showing F-actin concentrated mainly along the apical (initially convex) surface of the SE (yellow arrow). The basal (concave) side of the OV lacked substantial F-actin (blue arrow). (C, HH13+) section with fibronectin staining shows a bilayered ECM (blue arrow) between the invaginating OV and SE. (D, HH14−) ECM remained after SE removal (blue arrow). Scale bars 100 µm

