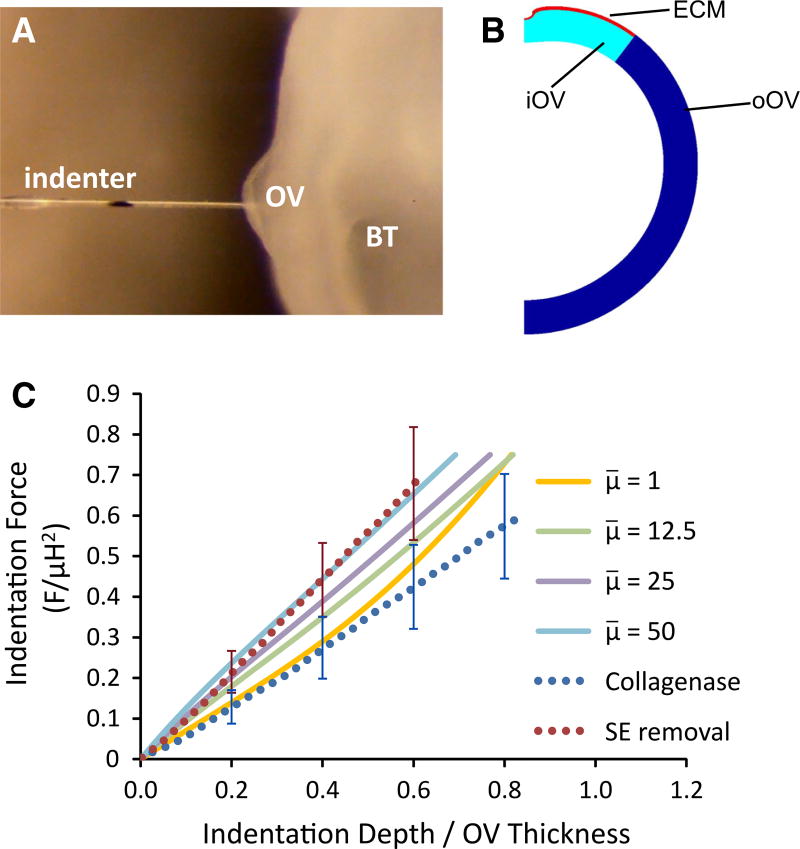
Fig. 6.
Microindentation testing to determine relative ECM stiffness. A Image of OV being indented (BT brain tube). Black mark on the indenter tip was tracked to determine displacement. B Finite-element model for OV indented at top. C Comparison of nondimensional force– displacement curves between experiment and model (F, indenter force; μ, shear modulus of OV; H, undeformed OV thickness). Model results are shown for various values of μ̄ = μECM/μOV. Experimental curves represent the averages of three OVs without the SE before (red dots) and after (blue dots) collagenase treatment; error bars represent standard deviation. Indentation stiffness (slope) decreases after collagenase exposure

