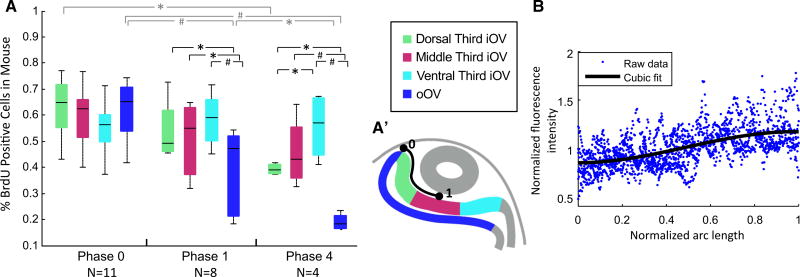
Fig. 9.
Cell proliferation and ECM distribution in embryonic eyes. (A) Cell proliferation at Phase 0 (E8.5), Phase 1 (E9.5), and Phase 4 (E10.5) was measured in the mouse embryo by counting the percent of BrdU positive cells in cross-sections in the oOV and three equal regions of the iOV (see A’). Horizontal black bars show significant differences between regions at a given phase, and gray bars between phases within a given region (two-way repeated measure ANOVA with Tukey’s test, *P < 0.05, # P < 0.001). Differences were significant between certain regions and stages with significant interaction between stage and region (P < 0.001). At Phases 0 and 1, proliferation in the three iOV regions was not significantly different suggesting uniform proliferation in the iOV. At Phase 4, proliferation of the dorsal third of the iOV was significantly lower than in the ventral third (P < 0.05). Proliferation significantly decreased in the oOV between each stage. (A’) Diagram shows the oOV and three regions of the iOV. The normalized arc length plotted in (B) is outlined in black from 0 to 1 (0 = dorsal contact point between OV and SE; 1 = center of the ECM, where the OV was most invaginated). (B) Fibronectin distribution between the OV and SE in the chick embryo at Phases 2–3. Fluorescence intensity was greater in the center than near the edge of the iOV (P < 0.001, t test comparing data between regions where arc length ≤0.1 and arc length ≥0.9), suggesting that the ECM is denser near the center of the iOV. Fluorescence intensity was normalized by average intensity in the ECM of each sample. A cubic polynomial was fit to the raw data (R2 = 0.34, y = −0.71x3 + 1.05x2 − 0.013x + 0.85)

