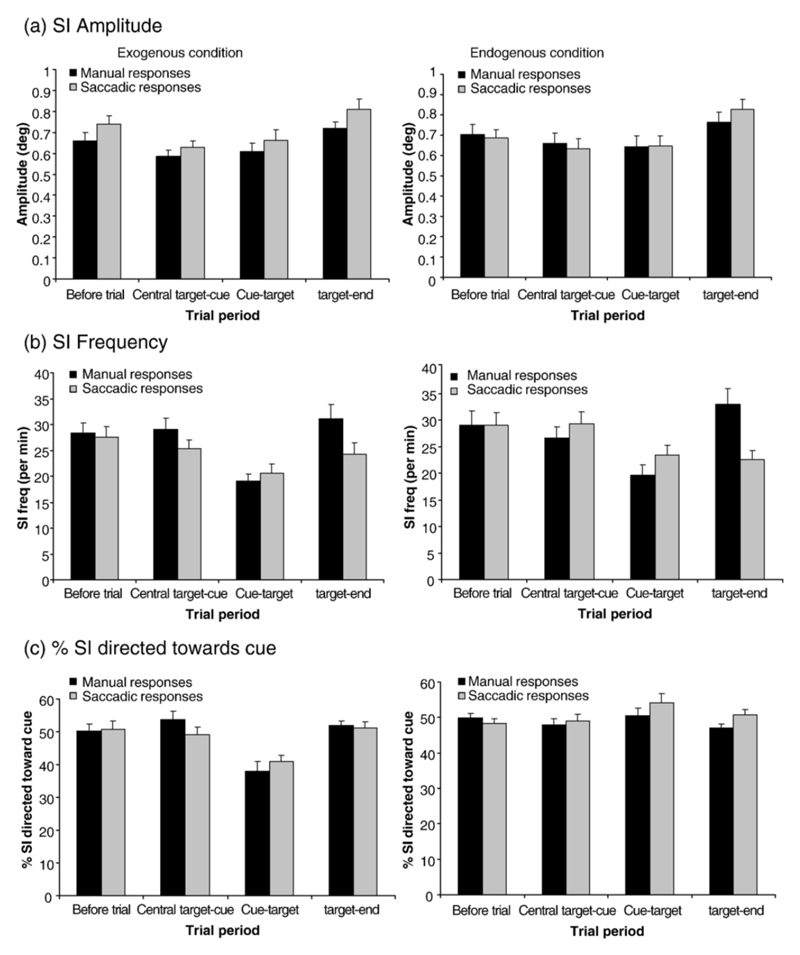
Fig. 2.
SI amplitude (a), frequency (b) and percent of SI directed towards the cue (c) for manual (black bars) and saccadic (grey bars) responses over the four different trial periods. Exogenous and endogenous conditions are shown on the left and right respectively. Cue types (same/different/neutral) are combined. Standard error bars are shown.

