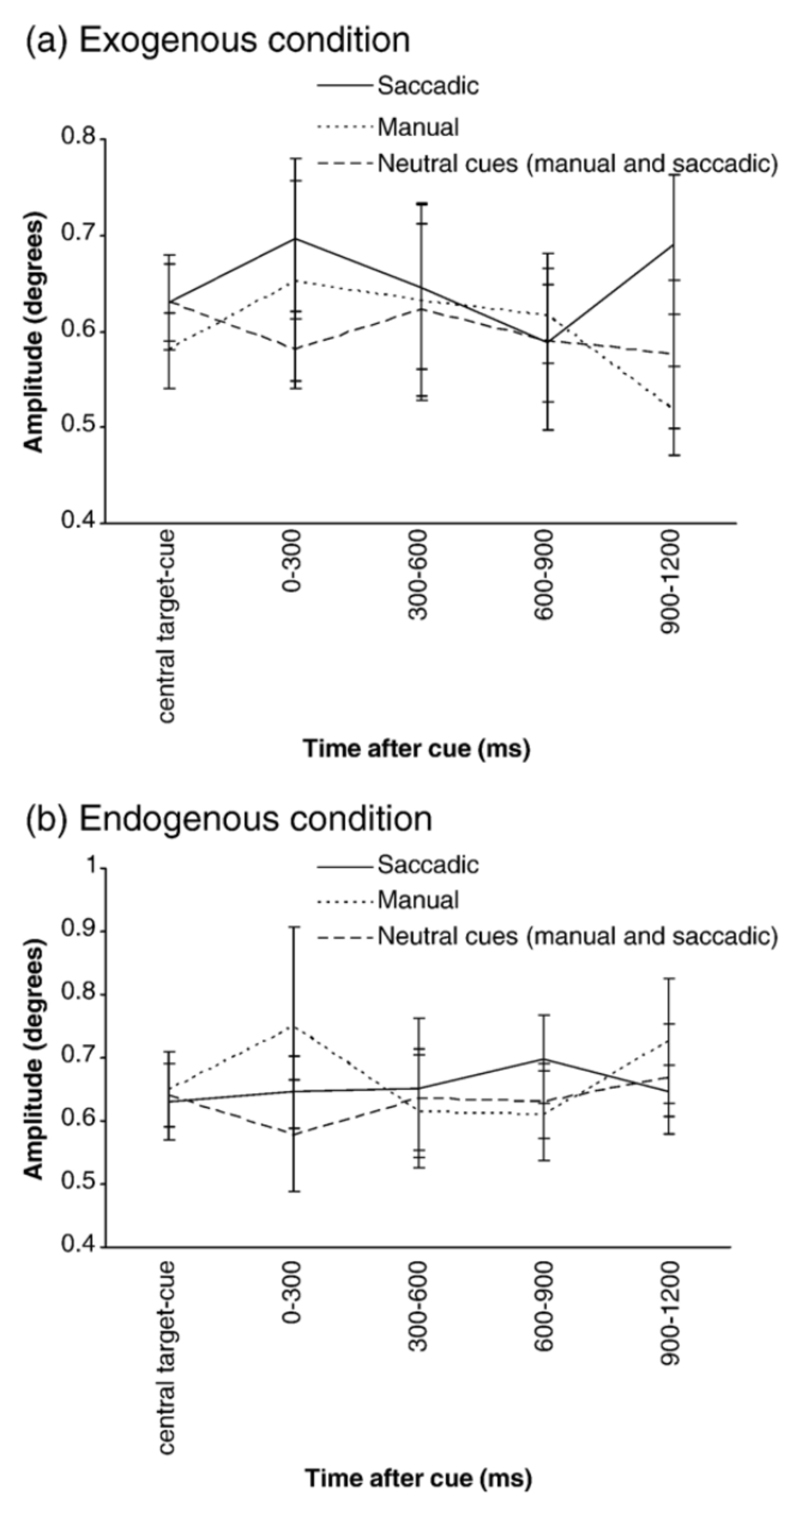
Fig. 3.
SI amplitude over the different time windows during the cue-target interval for the exogenous (a) and endogenous (b) conditions. Central target-cue = average SI amplitude over the preceding trial period (central target illumination-cue). Manual trials are denoted by the continuous line, saccadic trials by the dotted line and combined manual and saccadic neutral trials by the dashed line. Standard error bars are shown.

