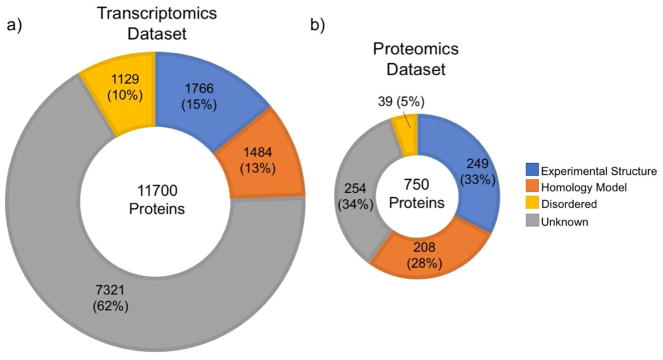
Figure 2. Pancreatic β-cell protein classes and structural coverage.
a, b) Structural Coverage of β–cell proteins identified in analyses of (a) transcriptomic and (b) proteomics data were categorized according to the amount of available structural information. The categories are Experimental Structures (PDB: sequence coverage ≥ 75%), Reliable Homology Models (SWISS-MODEL: sequence coverage ≥ 75%, normalized-QMEAN ≥ 0.6), Disordered Proteins (D2P2: Disordered residues ≥ 50%), Unknown (no reliable experimental structure, no reliable homology model, fraction of disordered residues < 50%). We used three transcriptomics datasets (Blodgett et al., 2015; Li et al., 2016; Nica et al., 2013) to create a combined list of genes expressed in β–cells. There were approximately 13,400 unique genes (with RPKM/FPKM/TPM values ≥ 1) in all three datasets combined. To improve confidence, we limited the list to genes present in at least two of the three datasets (11,606 genes) for which we could identify 11,700 protein products in UniProtKB (The UniProt Consortium, 2017) (Supplementary Table S1). For the proteomics dataset, we used the only available quantitative proteomics dataset specific to human pancreatic β–cells, which reported only 750 proteins (Brackeva et al., 2015) (Supplementary Table S2). Disordered content information came from the D2P2 database (Oates et al., 2013) and homology models were downloaded from SWISS-MODEL (Kiefer et al., 2009).

