
Figure 3.
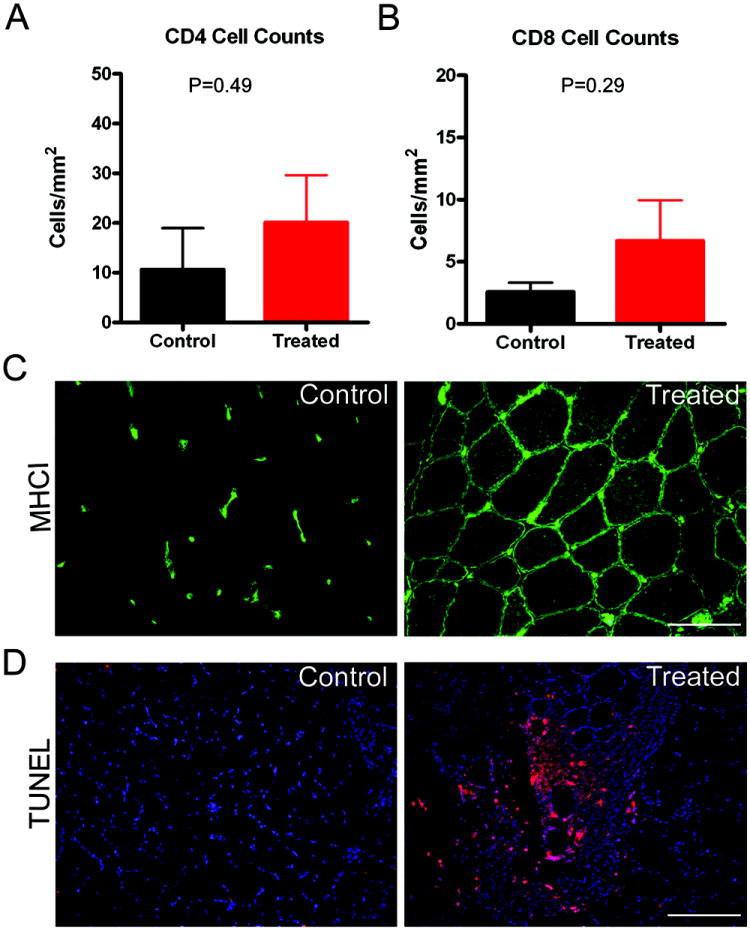
A) Compares the number of CD4+ mononuclear cells/ mm2 area between control and the side of gene transfer; B) Compares the number of CD8+ mononuclear cells/ mm2 area between control and the side of gene transfer; C) MHC I staining of muscle sections shows lack of staining of muscle fibers on control (left) side, while the side of gene transfer shows distinct staining of the sarcolemmal membrane in this subject (#3). Microvascular circulation in MHC I stained on both sides (scale bar = 100 μm). All three cases showed this same staining pattern on control and gene transfer sides; D) TUNEL positive mononuclear cells (red) seen in a perivascular location in a muscle section from subject 2. Other nuclei appear blue in DAPI stain (scale bar = 100 μm).