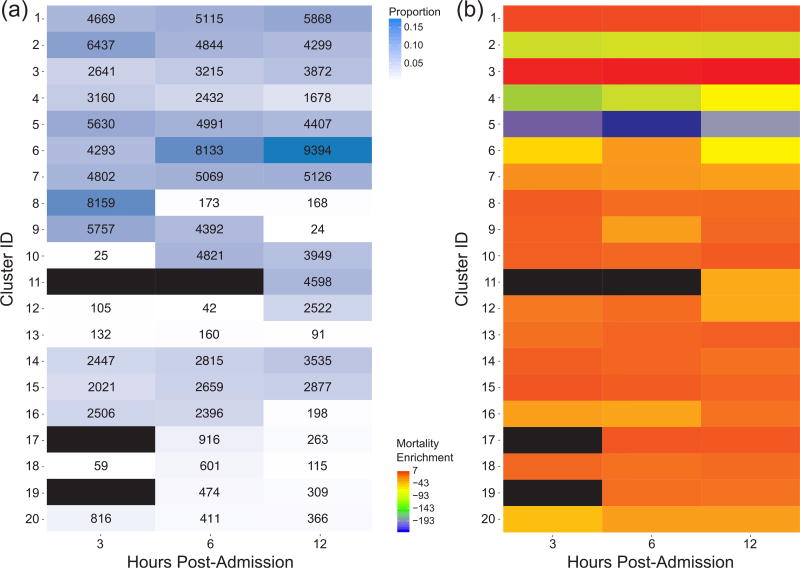
Fig. 4.
(a) Proportions of episodes assigned to each of 20 clusters for each post-admission period. The corresponding number of episodes assigned to each cluster are shown in each cell. (b) Mortality enrichment for each cluster and each post-admission period. The enrichment value is log(-log(p)) (for exposition purposes) where p is a one-tailed Fisher’s exact test p-value evaluating the significance of enrichment of mortality events for each cluster during a given post-admission period. Black cells indicate clusters to which no episodes were assigned during that post-admission period.

