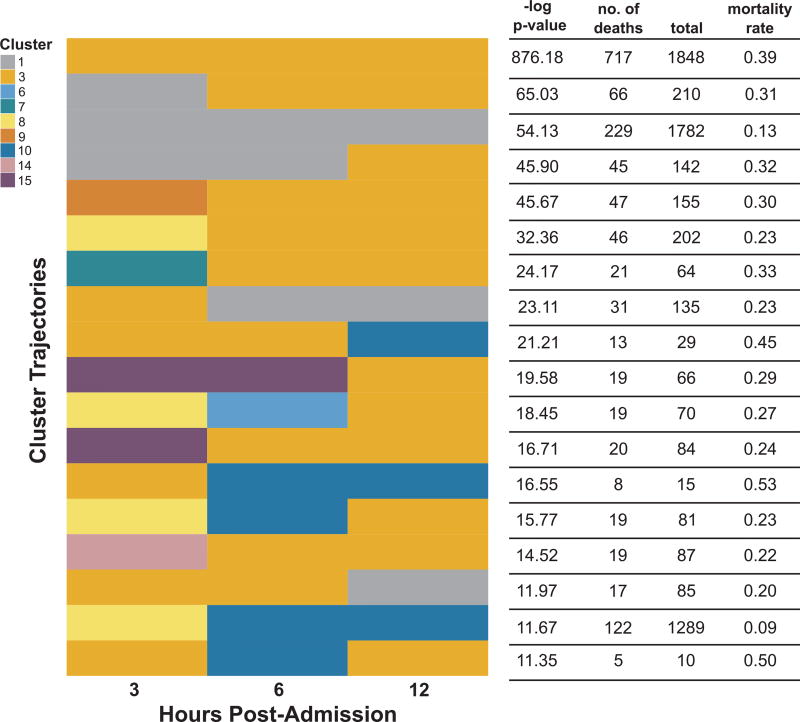
Fig. 5.
Cluster trajectories in the KPNC sepsis cohort enriched for mortality events. Trajectories are ranked in descending order by the -log p-value of a one-tailed Fisher’s exact test. A cluster trajectory appears in each row and consists of three cluster assignments, one for each of the three post-admission periods (3 h,6 h,12 h).

