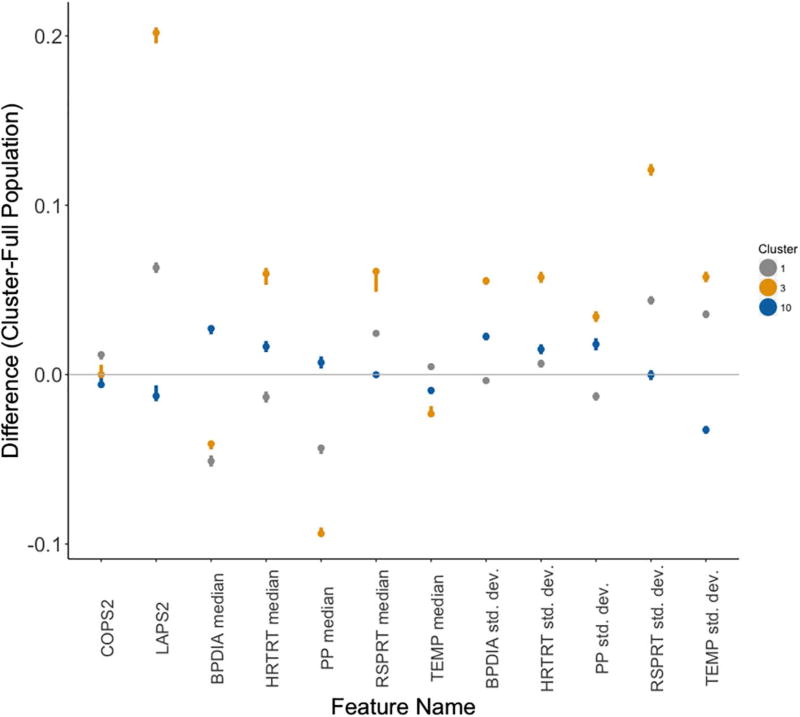
Fig. 6.
Estimated differences between cluster-specific and population values of each feature. The dots represent the estimated difference while whiskers represent the 95% confidence interval as computed by Wilcoxon rank-sum tests. The colors of each cluster’s dot and whiskers correspond to those in Fig. 5. The lack of an overlap between these intervals and a difference of 0 (gray line) reflects a significant difference in cluster-specific values of the feature as compared to the overall population. (For interpretation of the references to color in this figure legend, the reader is referred to the web version of this article.)

