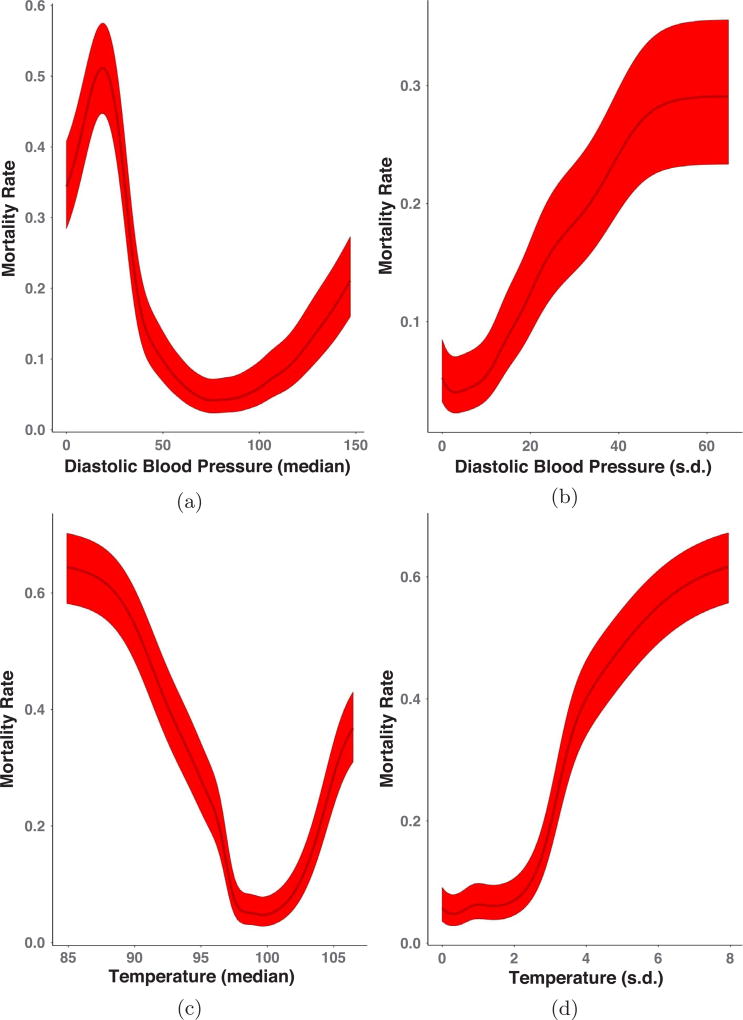
Fig. 7.
Marginal importance plots for diastolic blood pressure (in mmHg; median (a) and standard deviation (b)) and body temperature (in degrees Fahrenheit; median (c) and standard deviation (d)) at 12 h post-admission. The dark line in the center of the band is the estimated mortality rate at each value of the vitals feature of interest while the lighter bands are 95% Wilson score intervals.

