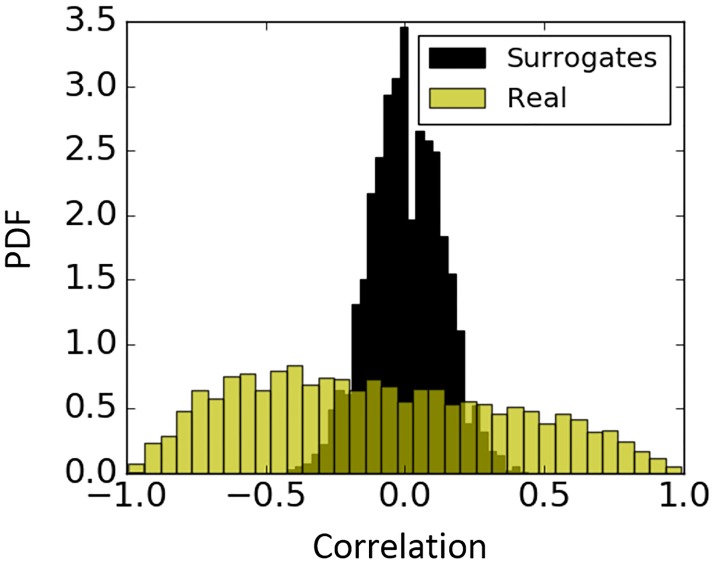
Fig 4. Probability density function (PDF) of Pearson correlation coefficient for surrogates and real data.
Correlation for real data is quantified between MAP and EEG sub-energy (0.3–3 Hz) feature (yellow); correlation between corresponding randomly permuted surrogates of MAP and sub-band energy (0.3–3 Hz) feature (black).

