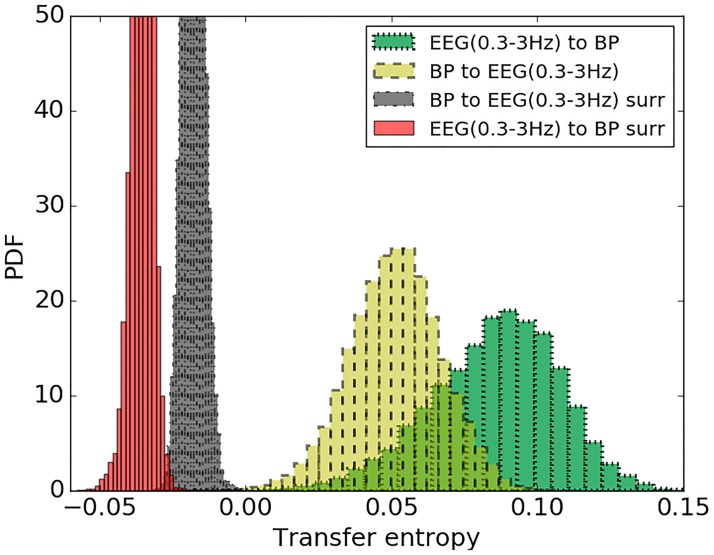
Fig 14. The distribution of TE values for real data and randomly permuted surrogates.
TE is quantified from MAP to EEG (0.3–3 Hz) for real data (yellow) and corresponding randomly permuted surrogates (black). TE from EEG (0.3-3Hz) to MAP for real data (green) and its randomly permuted surrogates (red).

