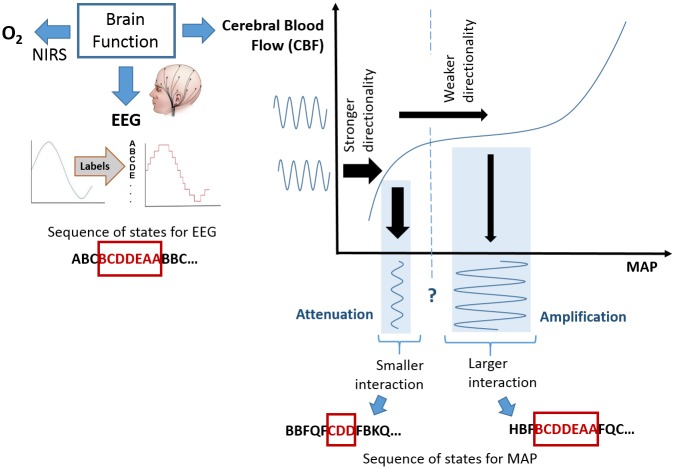
Fig 15. Schematic representation of the coupling between EEG and MAP using the autoregulation curve.
The plateau of the autoregulation curve is used as a benchmark of normal brain function. The MAP and EEG are represented by the sequence of states denoted with letters. A higher level of interaction is implied by a longer overlap in the sequences (same patterns). When the MAP falls below an unknown threshold, the dynamic interaction between EEG and MAP changes. A higher risk of mortality which is represented with higher CRIB scores is shown to be associated with a smaller interaction between EEG and MAP and a stronger directionality of this interaction (from EEG to BP).

