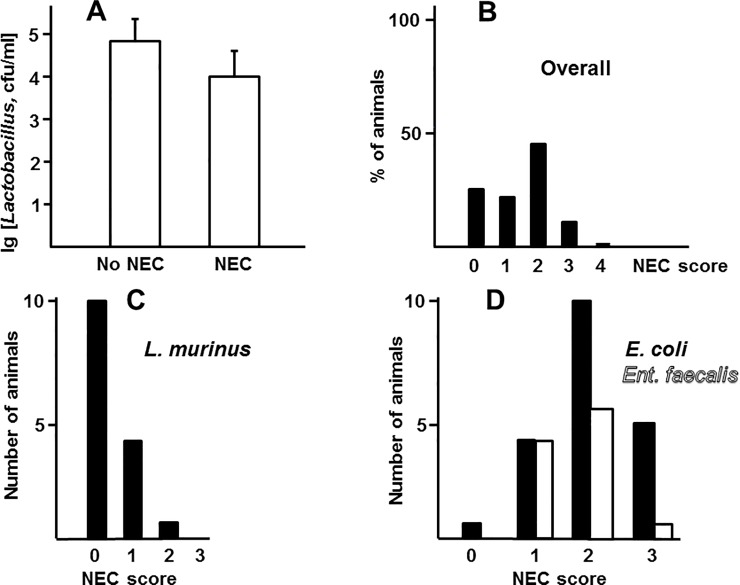
Fig 2. Association of NEC with lactobacilli.
A, average logarithms of Lactobacillus loads in healthy (NEC scores 0–1, n = 18) and sick (NEC scores 2–4, n = 28) animals. Differences between groups are not significant, p = 0.36, unpaired Student’s t test. B-D, distribution of NEC scores in the whole study cohort (B, n = 46) and in groups harboring L. murinus (C, n = 15) and E. coli (D, filled bars, n = 20) or Enterococcus faecalis (D, open bars, n = 11) at 25% or more of total bacterial populations. Score distributions in C, but not D, are significantly different from those in B (p values of <0.001, 0.17, and 0.16 respectively, χ2 test).

