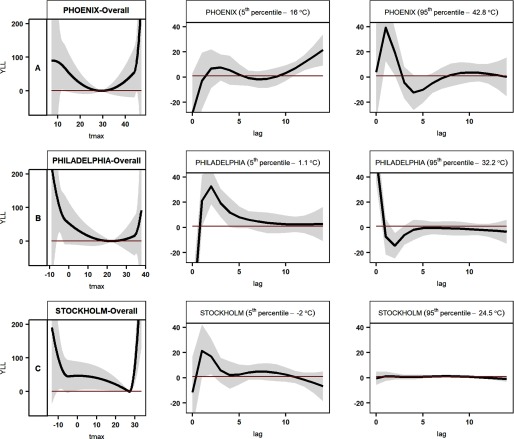
Figure 4.
Association between daily maximum temperature and YLL at high-income study sites. The overall estimates for each location (first column of panels A, B, and C, respectively) show YLL by temperature, cumulative over 14 days. The second and third columns show estimated differences in the YLL at the 5th or 95th percentile of daily maximum temperature, respectively, relative to the YLL at the reference temperature at each site, on the day of death () and up to 14 days prior to death. Tmax, daily maximum temperature; YLL, years of life lost. YLL estimates indicate the difference in years of life lost (the difference between life expectancy at the age of death and the age of death) relative to the YLL at the reference temperature for each site (the daily maximum temperature associated with the lowest average daily YLL). Gray shadings represent 95% confidence interval bands of estimates. Note: (A) Phoenix, (B) Philadelphia, and (C) Stockholm.

