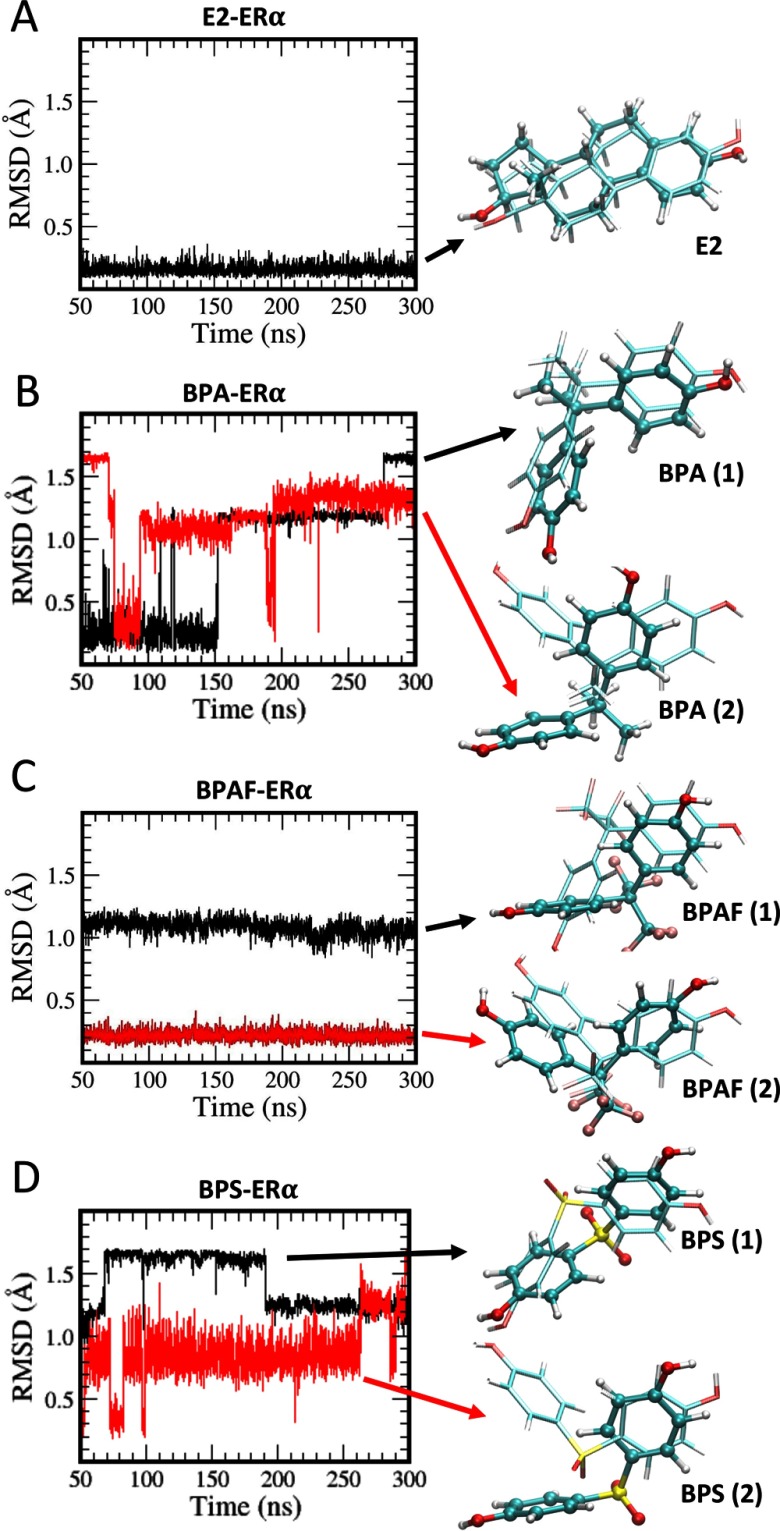
Figure 4.
Root mean square deviations (RMSD) of ligands. (A) estradiol (E2), (B) bisphenol A (BPA), (C) bisphenol AF (BPAF), and (D) bisphenol S (BPS). The black curve represents the system starting with the ligand in its canonical conformation (conformation 1), and the red curve represents the system started with the ligand in its alternate conformation (conformation 2). In each case, the estrogen receptor () is in the agonist form. The final ligand structures are also shown (in dark ball and stick model) with their starting conformations (in lighter stick model).

