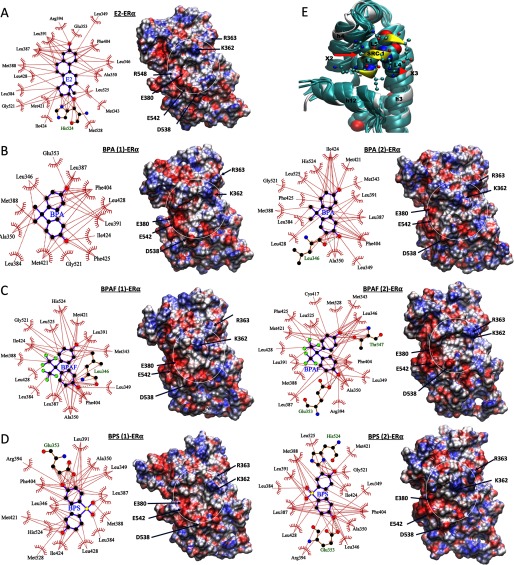
Figure 5.
Ligand interactions from the molecular dynamic (MD) structures. The ligand interactions with estrogen receptor (ER) that are found in the representative final structures from MD simulations of (A) estradiol (E2), (B) bisphenol A (BPA), (C) bisphenol AF (BPAF), and (D) bisphenol S (BPS). In B, C, and D, when the ligands were placed in the canonical conformation (conformation 1) at the beginning of the simulations, the systems are labeled as ligand (1)–, and when the ligands were placed in alternate conformations (conformation 2) in the beginning of the simulations, they are labeled as ligand (2)–. However, as noted from the figure, ligand conformations evolved during the dynamics. The corresponding electrostatic potential surface of is shown in left with the coregulator binding site of each system shown inside white circle. residues potentially interacting with coregulator residues are labeled. (E) Comparison of the structures near the coregulator binding surface from the MD simulations of ER with various ligands. The structures were superimposed based on the h3, h4, and h12 loops as the reference. All representative structures from various ligand-bound simulations are shown in teal, along with the starting X-ray structure of the E2-bound system (in white) with its steroid receptor coactivator 1 (SRC-1) peptide (shown in yellow). The 9-residue SRC-1 peptide from the X-ray crystal structure is also shown. The leucine residues of the motif are shown in the space-filling representation. The other residues from SRC-1 are represented in the ball and stick form.

