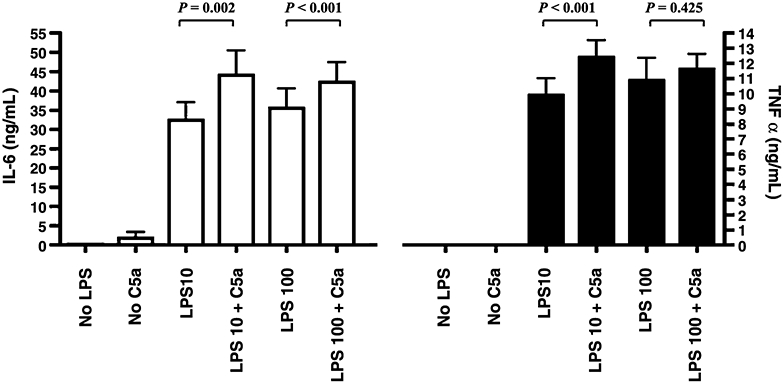
Fig. 2. Effect of C5a on LPS-induced IL-6 and TNF-α production in human PBMCs.

The PBMCs were treated with or without C5a (100 ng/mL) for an hour and then stimulated with LPS (10 or 100 ng/mL) as indicated. White bars represent IL-6 levels; and black bars, TNF-α. Data are represented as mean ± SEM. Results were analyzed using a paired t test.
