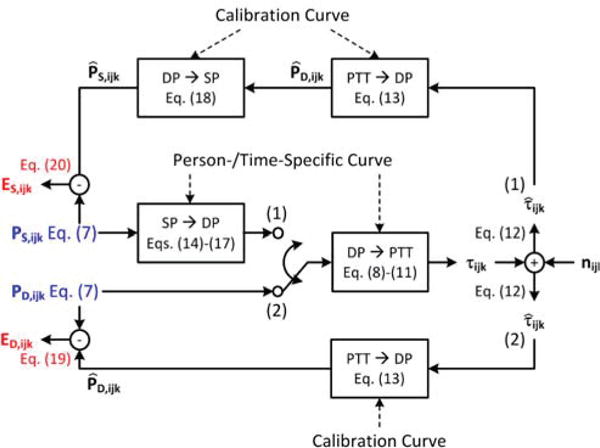
Fig. 2.

Model employed to predict the acceptable error limits for a PTT-based BP measurement system. The model input (blue) is either the true systolic BP or true diastolic BP, while the model output (red) is the corresponding measurement error of the PTT-based system. All mathematical symbols are completely defined in Eqs. (7)-(20).
