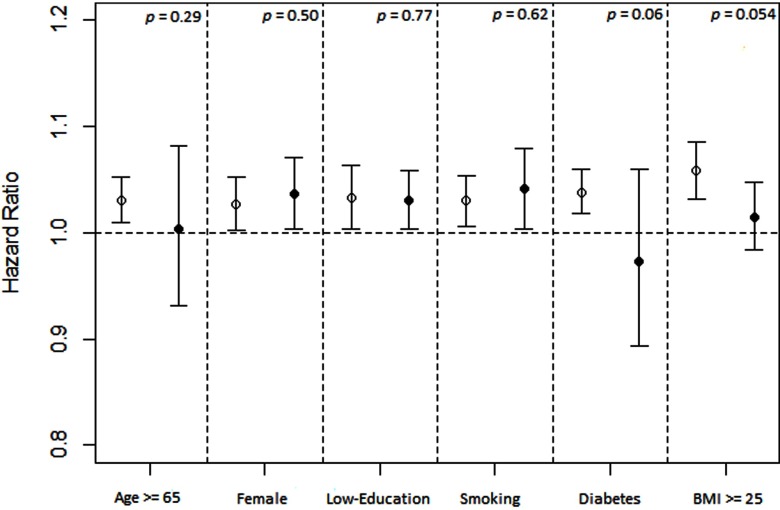
Figure 3.
Stratified analysis on associations between long-term exposure ( increments) and incident hypertension. Effect estimates (hazard ratios) are derived from Cox proportional hazard regression analysis, and bars cover 95% confidence intervals. Results were adjusted for age (not in age-stratified analysis), sex (not in sex-stratified analysis), education level (not in education level–stratified analysis), smoking status (not in smoking-stratified analysis), alcohol drinking, leisure-time physical activity, occupational exposure to dust or organic solvents in the workplace, season, body mass index (BMI; not in BMI-stratified analysis), diabetes (not in diabetes-stratified analysis), hyperlipidemia, and self-reported cardiovascular disease, stroke, or cancer. The lines with hollow circles from left to right represent the participants who were , were males, had a high education level, were nonsmokers, had no diabetes, and had BMI , respectively. The lines with solid circles from left to right represent the participants who were , were females, had a low education level, were smokers, had diabetes, and had , respectively. p-Values for interaction terms between (continuous variable) and each potential modifier (dichotomous variable) are calculated and presented in the figure.

