. 2018 Jan 12;126(1):017005. doi: 10.1289/EHP1992

Figure 1.

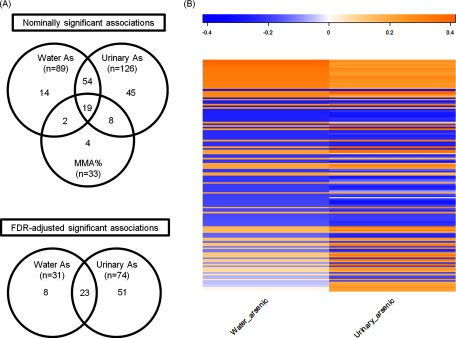
Figure 1A comprises two Venn diagrams. The one titled nominally significant associations has three circles labeled Water As (n = 89), Urinary As (n = 126), and MMA percent (n = 33). Water As and MMA percent intersect at number 2; Water As and Urinary As intersect at 54; and Urinary As and MMA percent intersect at 8. All three circles intersect at number 19. The other Venn diagram titled FDR-adjusted significant associations has two circles labeled Water As (n = 31) and Urinary As (n = 74), and they intersect at number 23. Figure 1B is a heat map of baseline total water arsenic and urinary arsenic.

Associations of reproducible molecular features with baseline total water arsenic and baseline total urinary arsenic. (A) A Venn diagram shows the overlap of the metabolites that had a significant association with water arsenic, urinary arsenic, and urinary MMA%. (B) Heatmap of multivariable Pearson correlations of baseline total water arsenic and urinary arsenic with the reproducible metabolites that were nominally significantly associated with water arsenic or urinary arsenic. The coefficients were adjusted for sex, age, and cohort memberships. Note: MMA%, percent monomethylarsonic acid.