
Fig. 3. Elucidating the sensing mechanism and control over the sensor performance.
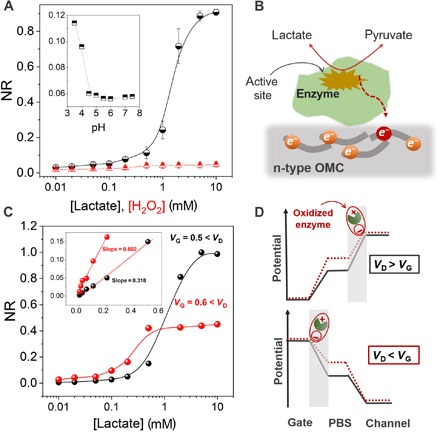
(A) NR of the OECT to H2O2 (red triangles) and to lactate in the presence of LOx (black circles). The inset shows the sensitivity of the device to pH. The pH was adjusted using HCl and measured with an external pH electrode. The plot shows that the sensor cannot catalyze H2O2 oxidation and exhibits negligible response to changes in pH. Error bars represent the SD from four measurements on two devices. (B) The proposed mechanism of lactate sensing based on the direct ET from the enzyme to the n-type OMC. (C) Normalized calibration curves of the device operated under different biasing conditions at the gate electrode for a VD fixed at 0.7 V. The inset shows the response of the device to lactate, this time represented in linear scale, with the slope indicating the sensitivity of the device. (D) The distribution of electrolyte potential at the critical interfaces (gate/electrolyte and channel/electrolyte) in the presence of the enzymatic reaction under different relative biasing conditions.