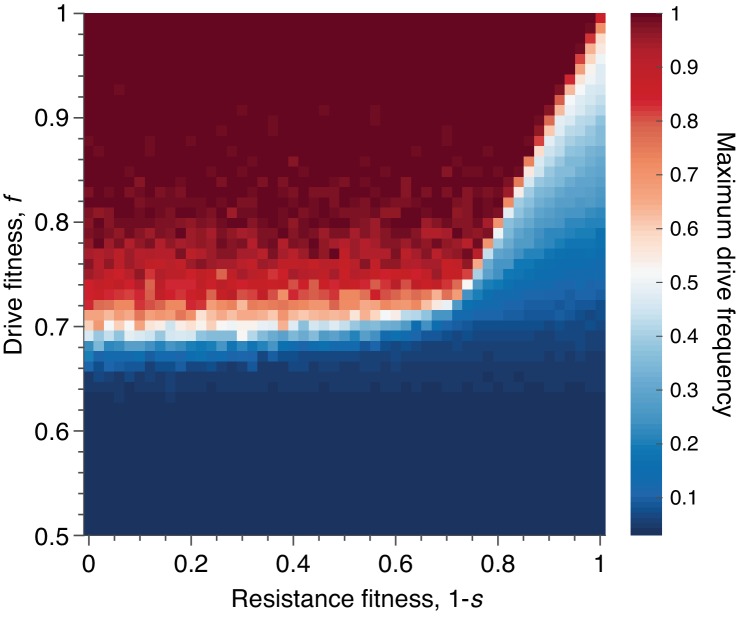
Figure 8. Mean peak drive for varying drive-individual fitness values, , and resistant-individual (RR) fitness values, , where is the cost associated with resistance.
Each point in the grid () depicts an average of 100 simulations. Parameters used include homing efficiency , population size of 500, with an initial release of 15 drive homozygotes to ensure that trajectories establish. Throughout we assume no standing genetic variation (i.e., the initial frequency of the resistant allele is 0).

