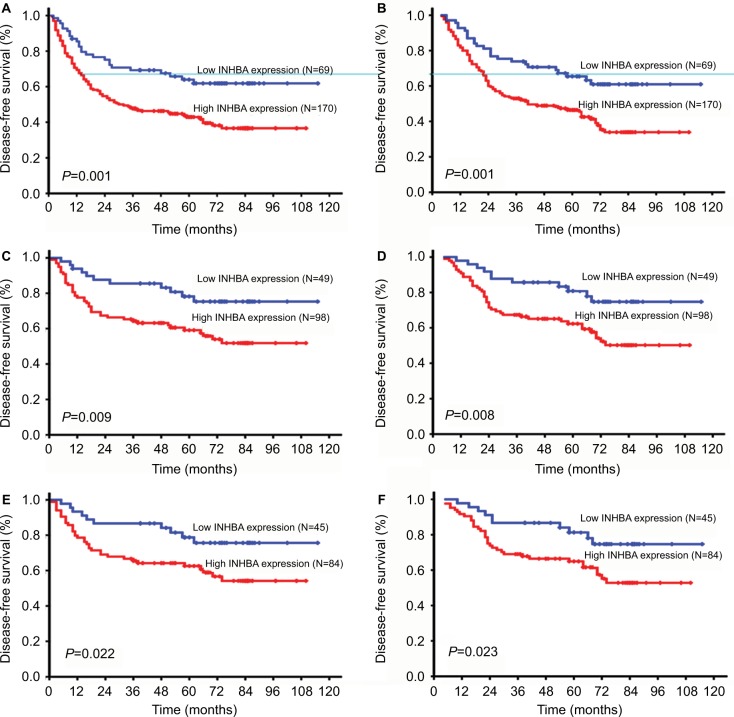
Figure 4.
Disease-free survival (DFS) and overall survival (OS) curves according to patients’ INHBA expression.
Notes: DFS curve in all patients with different levels of INHBA expression (A, P=0.001). OS curve in all patients with different levels of INHBA expression (B, P=0.001). DFS and OS curves in patients in TNM stage 1 and 2 with low and high INHBA expression (C, D, P=0.009 and P=0.008, respectively). DFS and OS curves in patients in N0 stage with low and high INHBA expression (E, F, P=0.022 and P=0.023, respectively).

