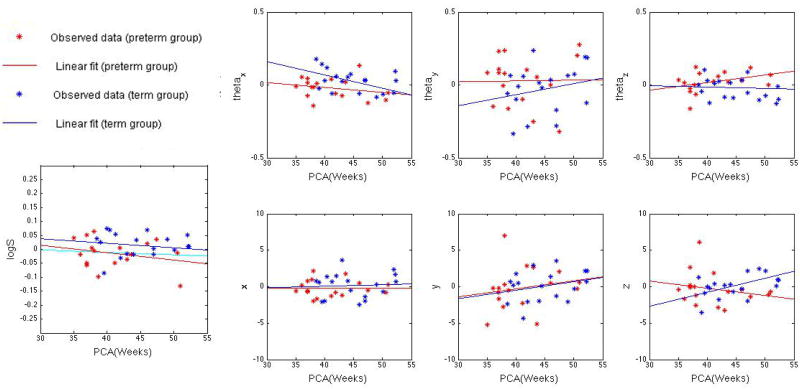
Fig. 2.
Distribution of 7 pose parameters in log-Euclidean space for the left thalamus: logS, (θx, θy, θz), (x, y, z). Stars in the figure represent observed data from Procrustes alignment, while lines represent their corresponding linear regressions. In all the figures above, data from preterm group are marked in red, and data from term group are marked in blue. Note that logS is approximately constant with post-conception age, indicating that the thalamus volume is near constant in that age range. However, a downward slope is seen in the preterm group. When very preterm subjects are removed from the sample (postconception age at birth < 31 weeks), the linear regression (shown in a cyan) for preterm subjects normalizes to a flat line, indicating a similar behavior to the term born subjects.

