. 2017 Dec 23;31:122. doi: 10.14196/mjiri.31.122
© 2017 Iran University of Medical Sciences
This is an open-access article distributed under the terms of the Creative Commons Attribution NonCommercial 3.0 License (CC BY-NC 3.0), which allows users to read, copy, distribute and make derivative works for non-commercial purposes from the material, as long as the author of the original work is cited properly.
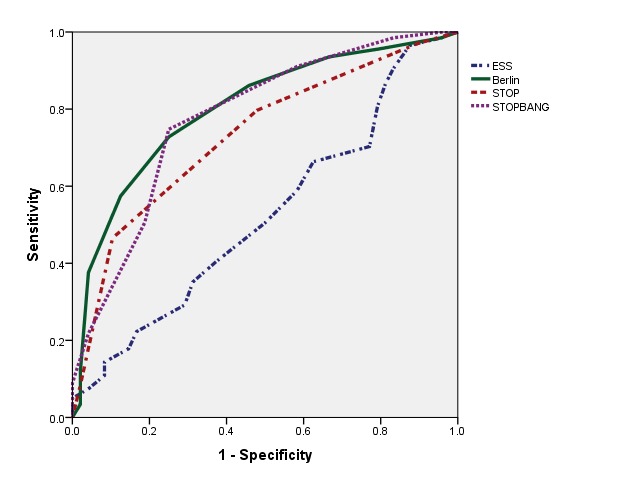
Fig. 2.

Area under the ROC curve to predict moderate to severe OSA
