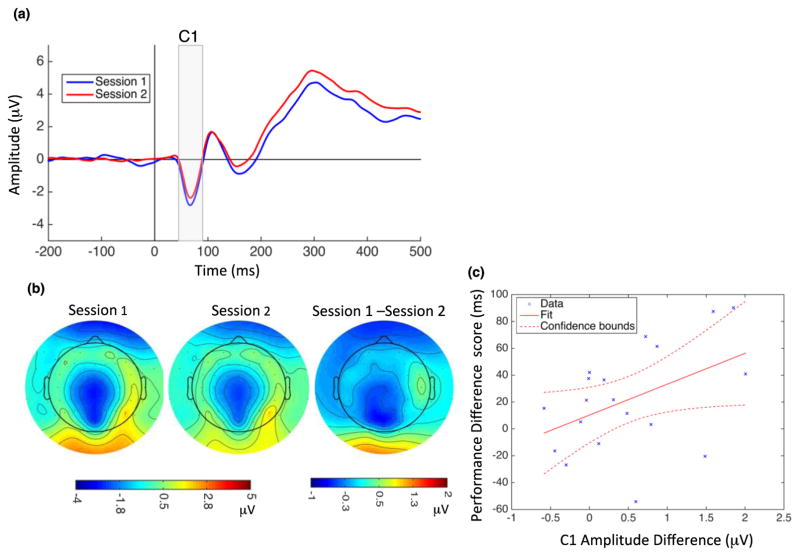
Figure 3.
Modulation of C1 amplitude by perceptual learning and correlation with behavioral changes. (a) Grand average ERPs recorded at Pz electrode site during Session 1 (blue) and Session 2 (red). Vertical line at zero indicates the onset of the TDT target array, and the gray highlighted rectangle indicates the temporal window used for C1 analysis. C1 amplitude significantly decreased following learning (mean C1 amplitude in Session 1: −1.80 μV, SD = 1.52; Session 2: −1.36 μV, SD = 1.45). (b) C1 topographical map at 70 ms after stimulus onset for Session 1 (left), Session 2 (middle), and their difference (right). (C) C1 amplitude changes and performance difference scores were significantly correlated. Dotted lines indicate 95% confidence interval.

