Figure 15.


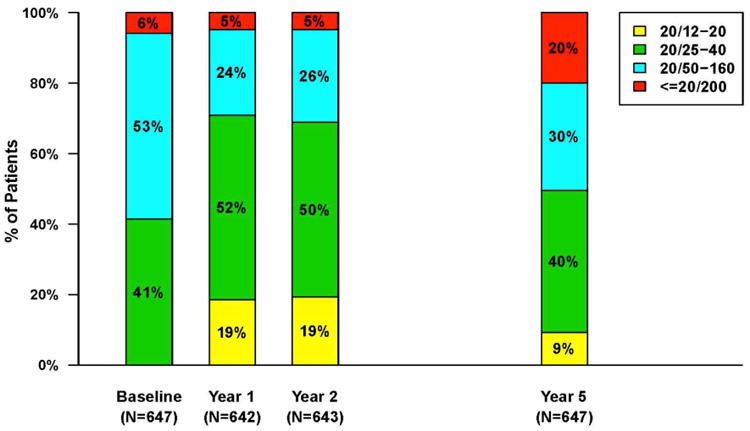
A) Bar graph showing the distribution of visual acuity over time for 647 patients in the CATT Follow-up Study. B) Mean visual acuity over time for patients in the CATT Follow-up Study


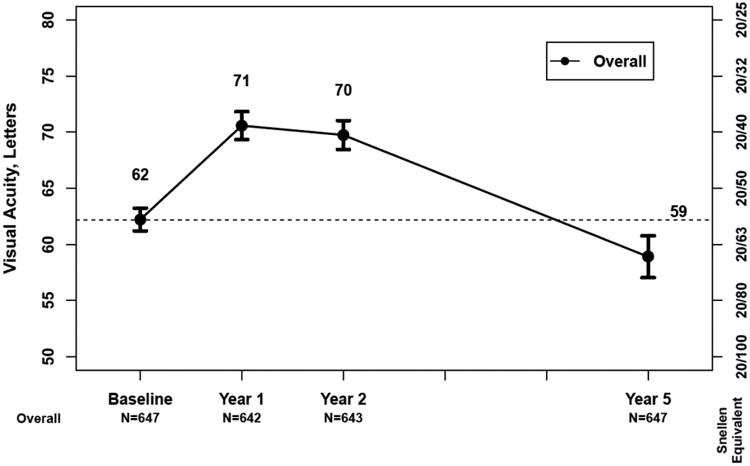
A) Bar graph showing the distribution of visual acuity over time for 647 patients in the CATT Follow-up Study. B) Mean visual acuity over time for patients in the CATT Follow-up Study